USCIS publishes, once a quarter, how many employment-based I-485s each field office received, approved, denied and still holds. That's enough to rank offices by how much backlog each one carries against the pace it's clearing it. It's a quarterly, dated snapshot, and the ranking below is for Apr 1 to Jun 30, 2026.
The file
The source is the Form I-485 performance data by field office, FY2026 Q3, at https://www.uscis.gov/sites/default/files/document/data/i485_performance_data_fy2026_q3_v1.xlsx, listed on USCIS's data page at https://www.uscis.gov/tools/reports-and-studies/immigration-and-citizenship-data. The employment-based columns give, per office, cases received, approved, denied and pending. Nationally for the quarter:
| Employment-based I-485, Apr 1 to Jun 30, 2026 | Count |
|---|---|
| Received | 97,501 |
| Approved | 42,076 |
| Denied | 3,160 |
| Pending at Jun 30 | 268,408 |
Two footnotes in the file limit what the numbers mean, quoted here because they're the caveats that matter. Footnote 8, on pending: "The number of applications awaiting a decision as of the end of the reporting period. Some actions taken on cases are not reflected in this report such as administrative closures and transfers between offices; thus the total pending counts cannot be calculated using data from previous reporting periods." Footnote 9, on the office column: "Represents the office location. The office location does not reflect the complete area covered by the office's jurisdiction."
How the ranking works
For each office: pending at Jun 30 divided by approvals during the quarter. That's how many quarters of backlog the office holds at the pace it just showed. It isn't a processing time and it isn't either of USCIS's two published measures (median vs 80% covers those). It's a ratio anyone can recompute from the file.
Two exclusions. Offices with fewer than 100 approvals in the quarter are left out, because one interview week moves their ratio by half. And the National Benefits Center is left out: the file shows it with 3,531 approvals and 0 pending, because it decides some cases and transfers the rest to field offices, so its ratio is zero for a reason that says nothing about waiting.
Smallest backlog per approval
| Field office | Received | Approved | Pending | Quarters of backlog |
|---|---|---|---|---|
| Fort Smith | 251 | 428 | 600 | 1.4 |
| St. Albans | 95 | 268 | 377 | 1.4 |
| Harlingen | 102 | 211 | 331 | 1.6 |
| Imperial | 14 | 134 | 213 | 1.6 |
| Agana | 95 | 349 | 653 | 1.9 |
| Spokane | 87 | 219 | 422 | 1.9 |
| Yakima | 81 | 225 | 452 | 2.0 |
| San Fernando Valley | 815 | 2,678 | 5,554 | 2.1 |
| Los Angeles | 2,199 | 2,947 | 7,710 | 2.6 |
| Fresno | 237 | 378 | 1,028 | 2.7 |
| San Bernardino | 506 | 1,179 | 3,319 | 2.8 |
Most of the top of this list is small offices. San Fernando Valley and Los Angeles are the ones with real volume, and both approved more employment-based I-485s in the quarter than they received.
Largest backlog per approval
| Office | Received | Approved | Pending | Quarters of backlog |
|---|---|---|---|---|
| San Antonio | 2,437 | 137 | 4,652 | 34.0 |
| Texas (SSC) | 1,162 | 190 | 6,203 | 32.6 |
| Charlotte | 1,566 | 119 | 3,682 | 30.9 |
| Tampa | 1,255 | 102 | 2,905 | 28.5 |
| California (WSC) | 1,532 | 789 | 21,053 | 26.7 |
| Orlando | 2,096 | 218 | 5,172 | 23.7 |
| Baltimore | 3,766 | 267 | 6,302 | 23.6 |
| Detroit | 1,825 | 155 | 3,552 | 22.9 |
"Texas (SSC)" and "California (WSC)" are the file's own labels, and the codes mark them as service centers rather than field offices. A ratio of 34 doesn't mean a 34-quarter wait. It means that in this one quarter San Antonio approved 137 employment-based I-485s while holding 4,652, and received 2,437 more. Footnote 8 is the reason to read it as a snapshot: cases transfer between offices, and the file doesn't say how many.
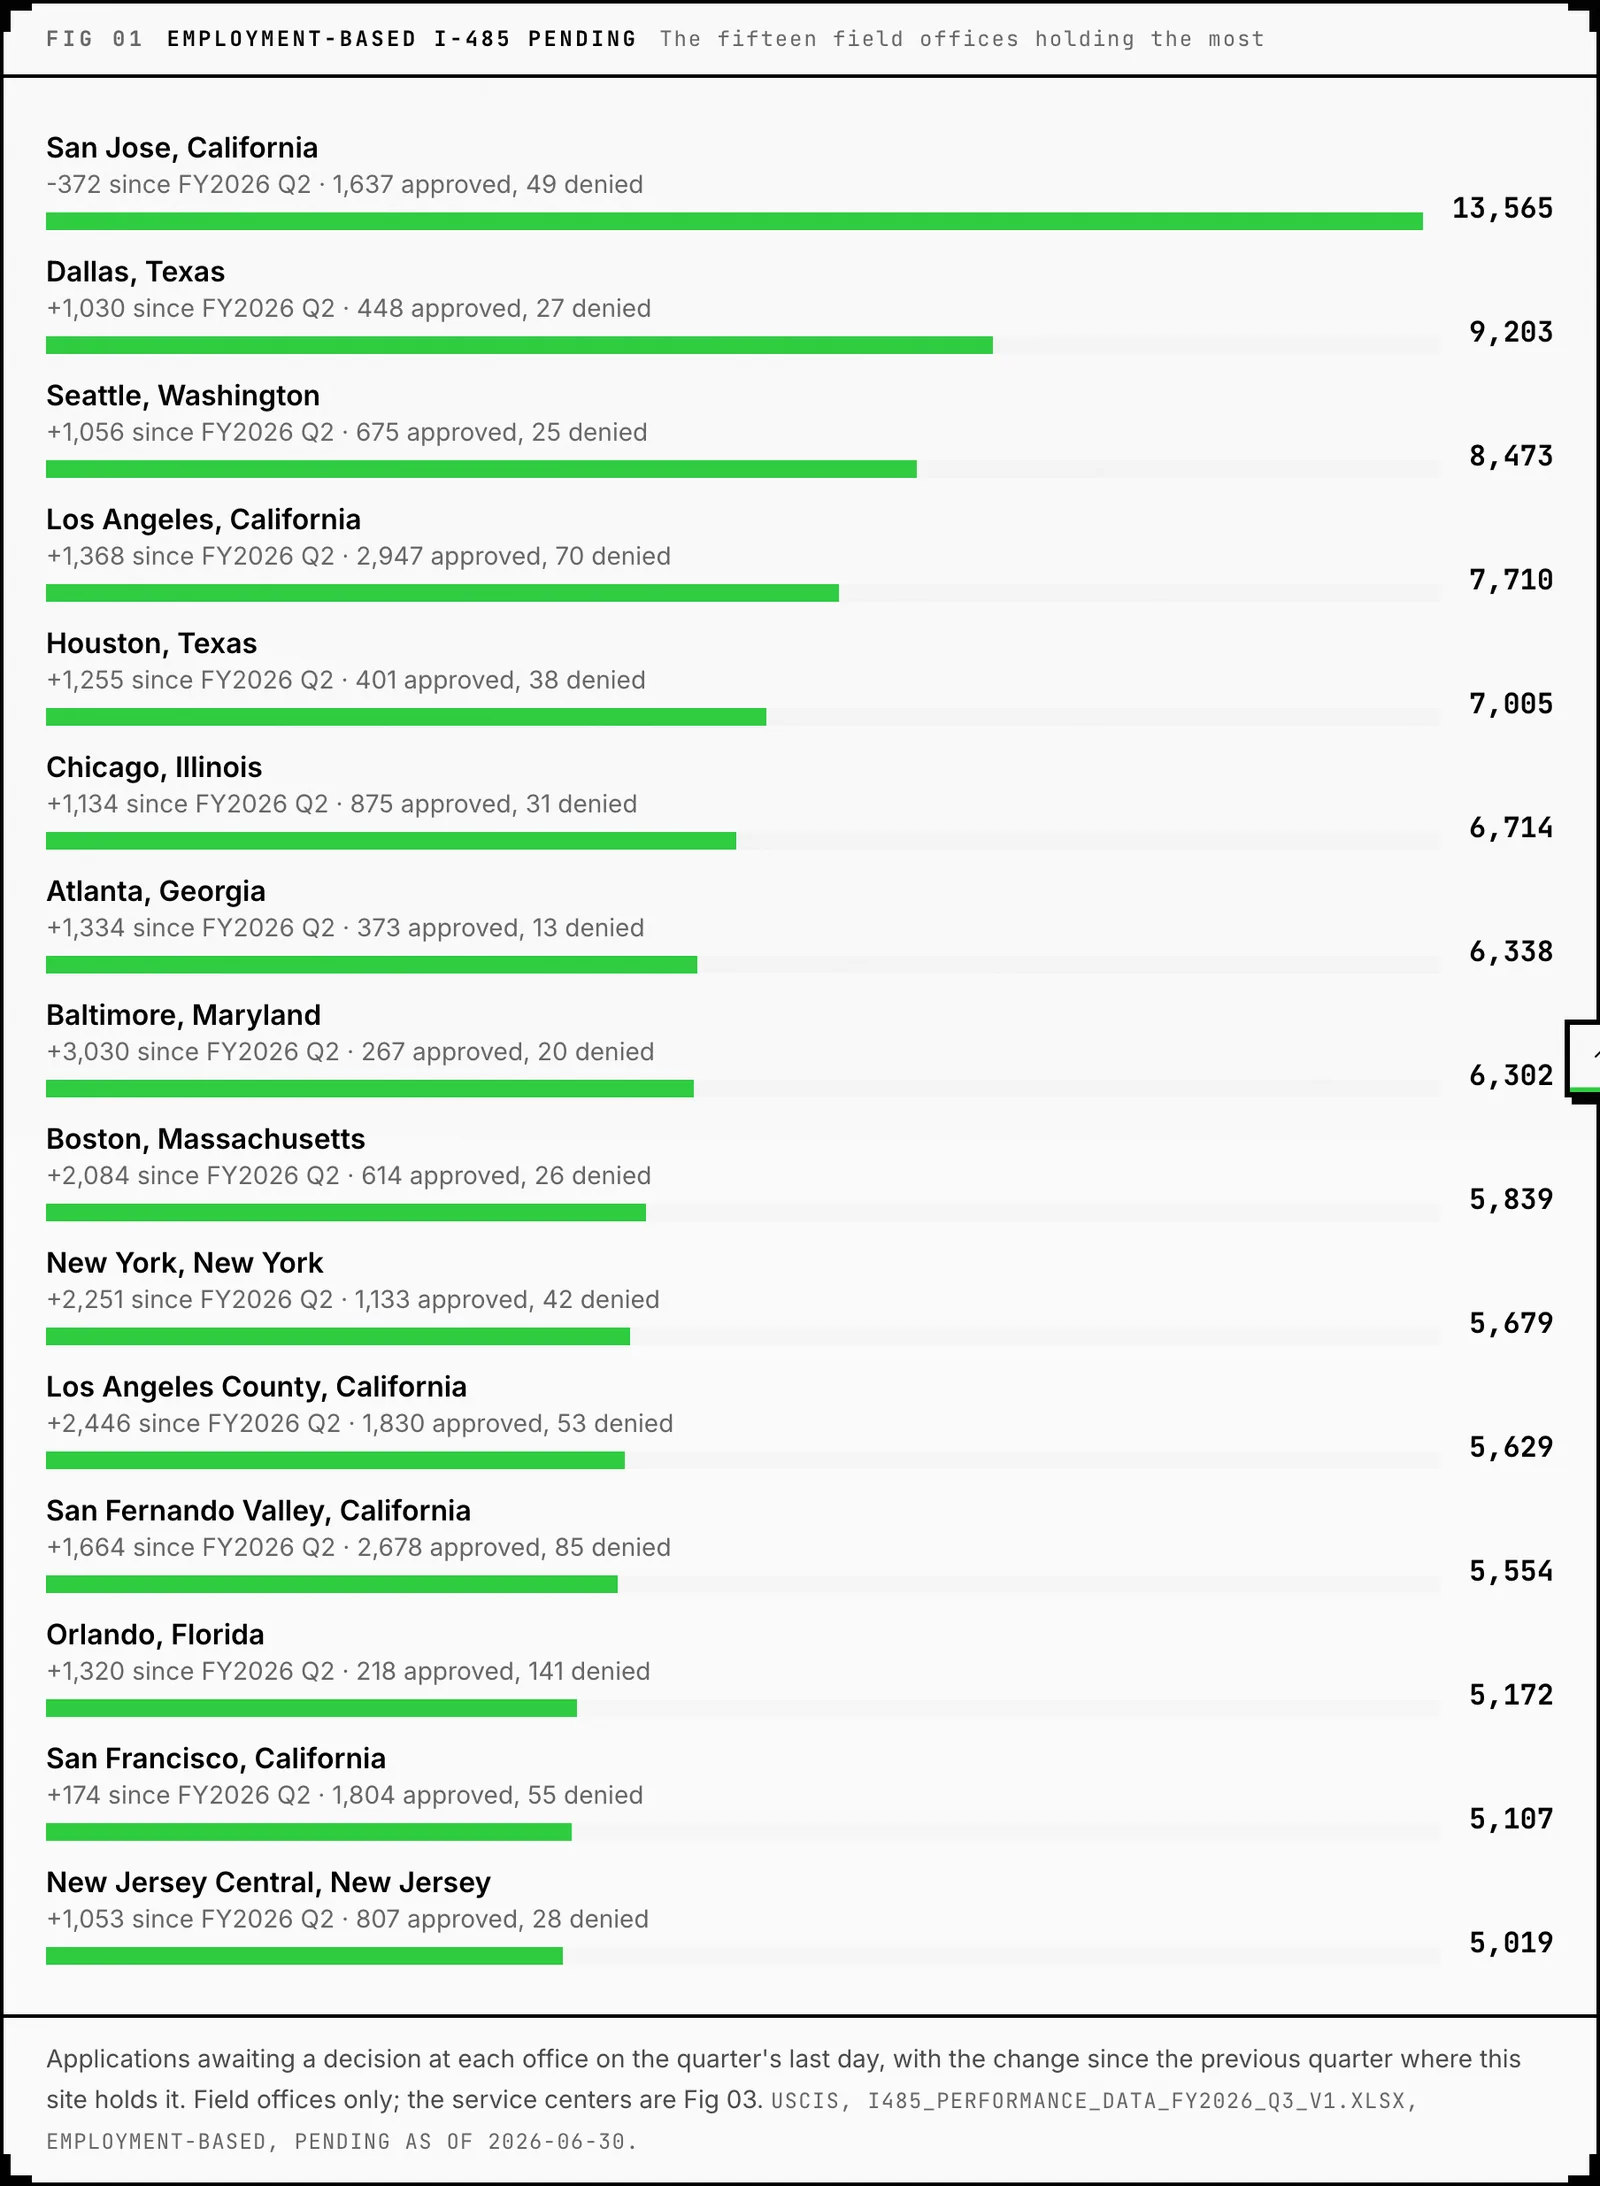
The biggest queues, by count
| Office | Pending at Jun 30, 2026 |
|---|---|
| California (WSC) | 21,053 |
| San Jose | 13,565 |
| Dallas | 9,203 |
| Seattle | 8,473 |
| Los Angeles | 7,710 |
| Houston | 7,005 |
| Chicago | 6,714 |
| Atlanta | 6,338 |
Pending includes cases that can't be approved yet because no visa number is available for them, which for EB-2 India is currently every case; the file doesn't split pending by that. The I-485 queue position tool reads USCIS's separate inventory by priority date, which does.
The I-485 by field office page carries every office from the file, with the quarter it describes, and updates when USCIS posts the next one. The next file covers Jul 1 to Sep 30, 2026.
What this can't tell you
- Which office holds your case. Your receipt and interview notices say. The receipt number guide covers reading them.
- Whether you can pick an office. Footnote 9 says the listed location doesn't describe the office's jurisdiction and sends you to USCIS.gov for that. USCIS assigns; this file doesn't say how.
- How long your case will take there. A backlog ratio is a quarter's snapshot, not a queue position for one case.
- How many pending cases are waiting on a visa number. The file doesn't split them. The inventory behind the queue tool does, by priority date.
- The interview itself. Scheduling, the medical and what's asked are separate topics; the I-693 medical exam guide covers one of them.