Ask "how long does USCIS take on an I-140" and you'll get two honest answers that disagree by months. Both come from USCIS. They measure different things.
The number on the processing times page
The figure at https://egov.uscis.gov/processing-times/ is defined on USCIS's own explanation page, https://egov.uscis.gov/processing-times/more-info. That page answers scripts with a bot challenge, so the wording below was read from the Internet Archive's capture of it dated Jan 30, 2024, and hasn't been re-verified against the live page.
"The processing time displayed on the USCIS website is the amount of time it took us to complete 80% of adjudicated cases over the last six months."
USCIS's own worked example: "if we completed 1,000 Form N-400 applications in the previous six months, and 80% (or 800) of them were completed within 60 days (or two months), then the processing times webpage will display two months as the processing time for Form N-400 in May 2022."
So it's an 80th percentile of completion times, over a rolling six months, published per form and subtype, and per office where USCIS still lists one. On Sep 26, 2026 the page said it's moving every service-center form to a single listing, Service Center Operations; every I-140 subtype is already there. The same page notes that "some forms use an older methodology known as 'cycle time'", which "measures how many months' worth of cases are awaiting a decision".
The number in the quarterly files
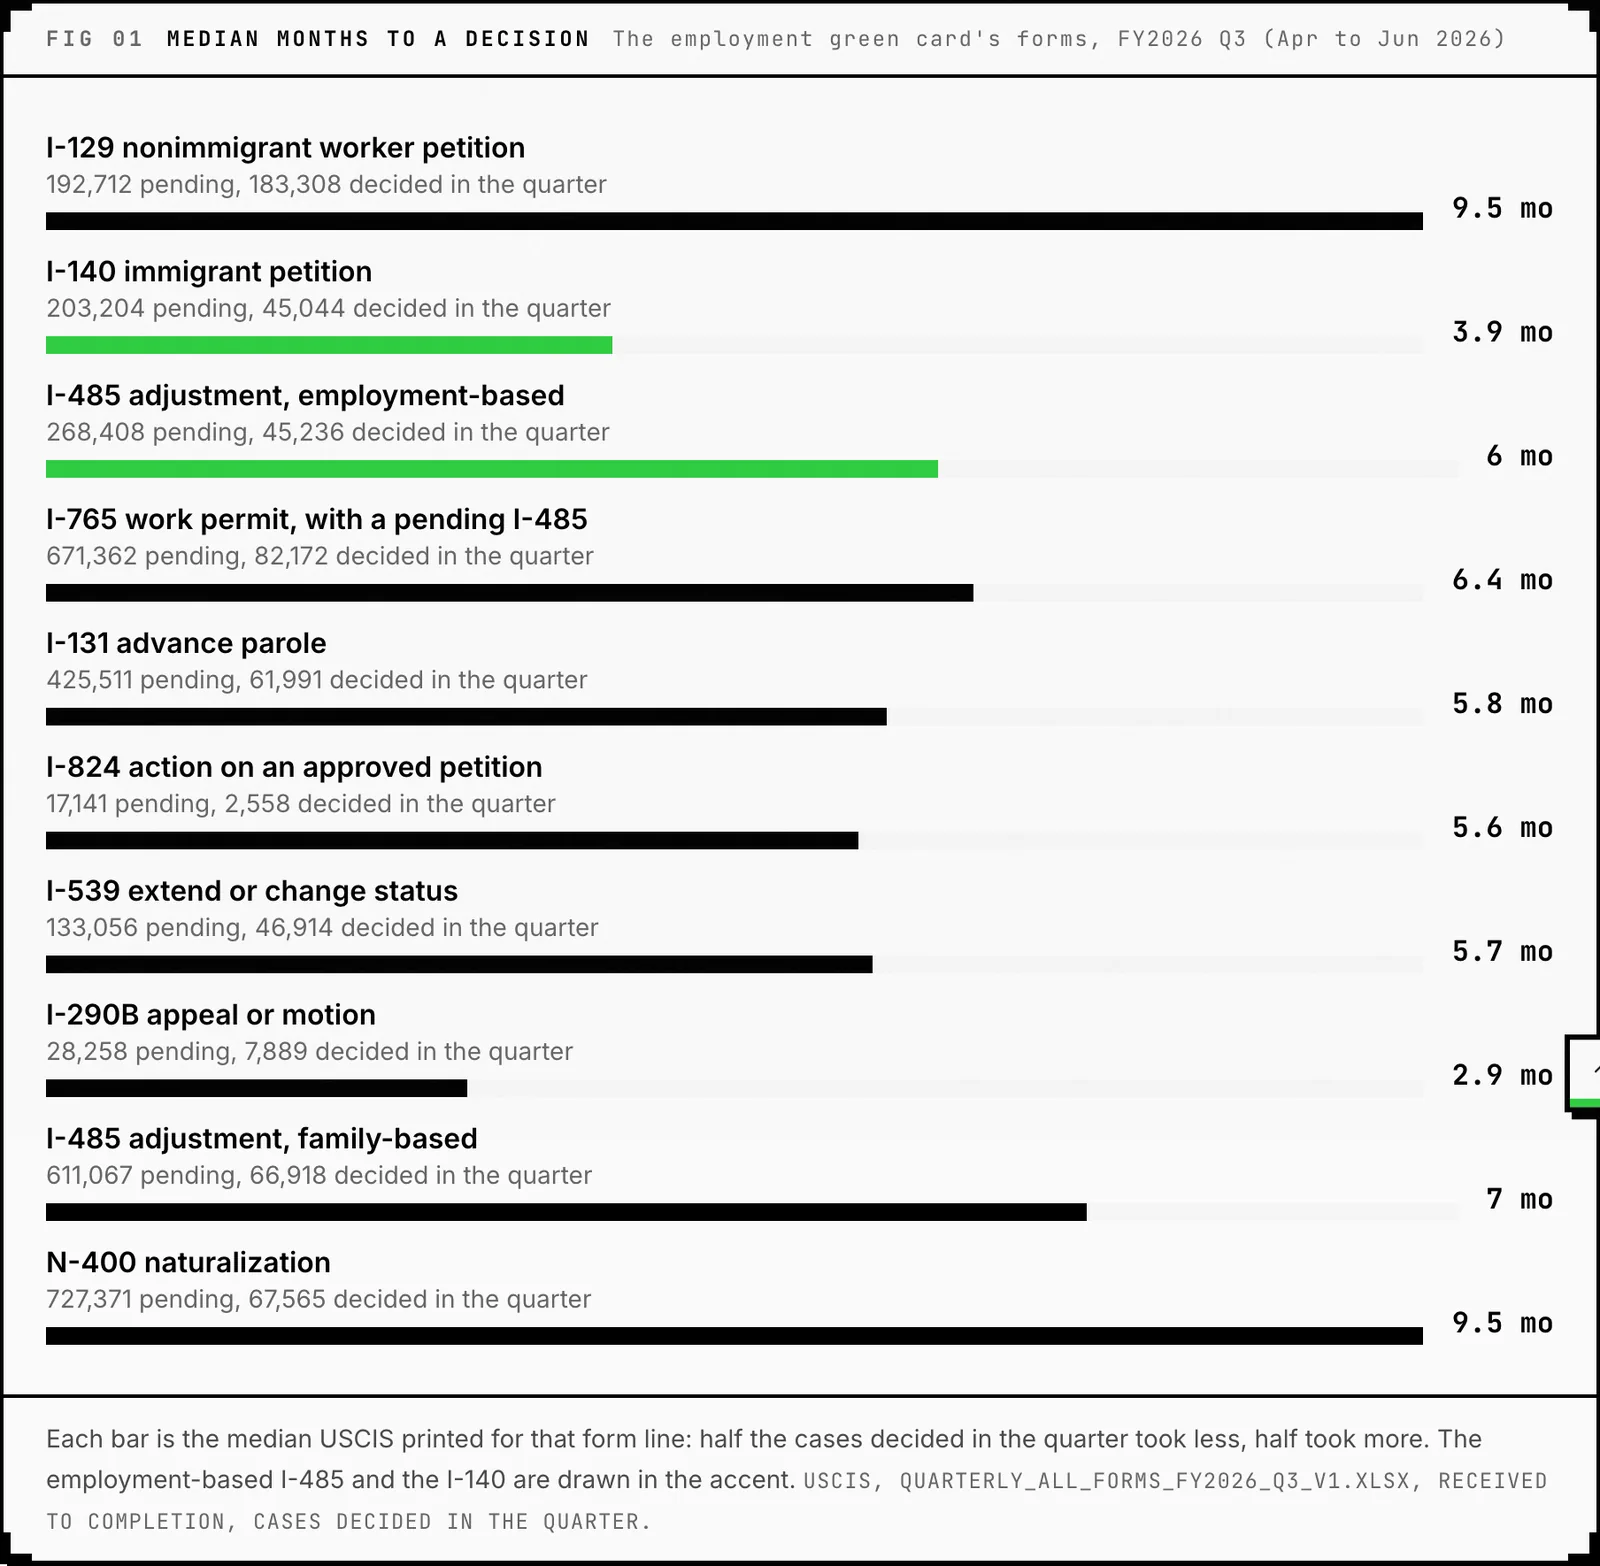
Every quarter USCIS posts a spreadsheet of receipts, approvals, denials, pending and a processing time for every form, listed at https://www.uscis.gov/tools/reports-and-studies/immigration-and-citizenship-data. The FY2026 third-quarter file (Apr 1 to Jun 30, 2026) is https://www.uscis.gov/sites/default/files/document/data/quarterly_all_forms_fy2026_q3_v1.xlsx.
USCIS's historical fact sheet, https://www.uscis.gov/sites/default/files/document/fact-sheets/historical_pt_factsheet_fy16_to_fy24.pdf (data as of Mar 5, 2024), defines that column: "the number of months shown is the median. It represents the time it took to complete half of the cases in a given time period."
The same fact sheet carries a note that the historical figures "are not comparable to the processing times posted on the USCIS processing times webpage" because of "different methodologies (cycle time methodology versus processing time methodology)". That note and the median definition sit in the same document, and this guide quotes both rather than reconciling them.
The same forms, both ways
| Form | Median, FY2026 Q3 file | 80% figure, processing times page |
|---|---|---|
| I-140, all subtypes | 3.9 months | 3 to 32.5 months by subtype, read Sep 26, 2026 |
| I-485, employment-based | 6 months | 9.5 months across all field offices, 42.5 at Service Center Operations, read Sep 26, 2026 |
| I-765, adjustment of status based | 6.4 months | per office |
| I-131, advance parole inside the US | 5.8 months | per office |
The I-140 row is the clearest illustration. The median lumps every I-140 subtype into one number. The 80% page splits them, and on Sep 26, 2026 it showed EB-2 advanced degree at 3 months and the national interest waiver at 30 months. Both facts are true at once: half of all I-140s finish inside 3.9 months because the ordinary EB-2 and EB-3 petitions are quick, and an NIW filer waiting two and a half years is inside the same average. The I-140 calculator uses the per-subtype figures for that reason, and I-140 trends charts the quarterly counts behind the median.
Why they differ
- Percentile. The median is the 50th; the page is the 80th. On any skewed queue the 80th is well above the 50th.
- Window. The page uses the last six months of completions. The file is one quarter.
- Grain. The page splits by subtype and office. The file gives one national number per form.
- Denominator. Both count completed cases only. Neither says anything about the cases still pending, which is the number that decides how long a new filing waits. The file gives that count separately: 203,204 I-140s and 268,408 employment-based I-485s pending at Jun 30, 2026.
Which to read
For "are most cases like mine done by now", read the 80% page for your form and subtype, and your office where it still lists one. For "is USCIS getting faster or slower on this form", read the medians across quarters; the fact sheet's series runs FY2016 to FY2024 and the quarterly files continue it. This site's USCIS processing times page shows the file medians with the quarter each one describes, and the EAD and advance parole guide reads the same file for the two forms most people are waiting on while an I-485 is pending.
Neither number is a forecast for your case, and the DOL side has the same split: PERM processing times publishes averages over decided cases, which carry the audit tail, while the queue position is a separate figure.
What this can't tell you
- Your case's time. Both figures are distributions over other people's cases.
- Whether premium processing cases are inside the 80% figure. The pages read for this guide don't say.
- The current quarter. The file for Jul to Sep 2026 isn't published yet; the newest is Apr to Jun.
- The live 80% figures. They're read by hand from USCIS's page because it refuses scripts, so the date they were read is part of the number.