Three pages here answer wage questions, each from a different angle. This walks through all three, and then through the part that matters most, which is why one number taken on its own will usually mislead you.
What the wage on a PERM case actually is
Every certified PERM application carries an offered wage. The employer put it on the ETA-9089 and DOL published it. It has to meet or beat the prevailing wage determination DOL issued for that job in that area, so it's a floor set by the process, not a survey of what people earn. Bonuses, equity and overtime aren't in it. Hourly and other pay units are annualised before any percentile is taken.
The determinations themselves are held too, about 634,600 of them, each with the wage DOL set, the occupation, the worksite state and how long it stays valid.
Start with the whole ladder
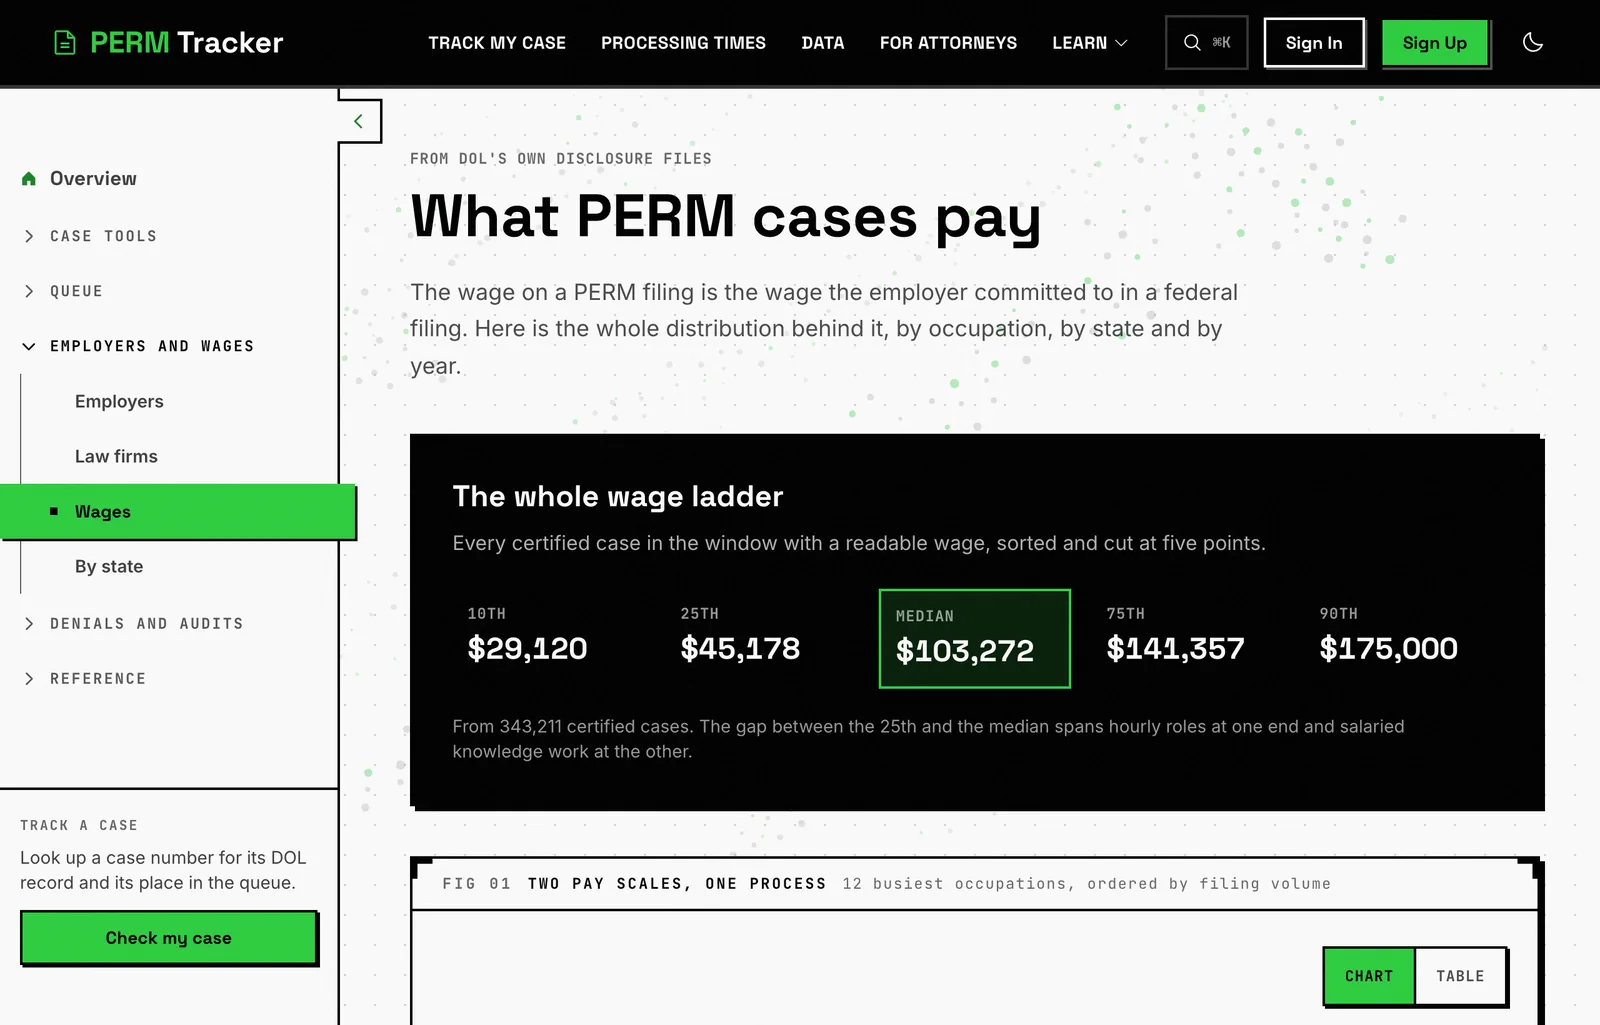
The wages page opens with every certified case in the current disclosure window, sorted and cut at five points.
| Percentile | Offered wage |
|---|---|
| 10th | $29,120 |
| 25th | $45,178 |
| Median | $103,272 |
| 75th | $141,357 |
| 90th | $175,000 |
That's from 343,211 certified cases. A percentile is only a position in a sorted line. The 25th means a quarter of certified cases came in at or below $45,178. Nothing is averaged and nothing is modelled.
The gap between the 25th and the median is the whole character of this dataset. Hourly work sits at one end and salaried knowledge work at the other, and both run through the same federal process at the same time.
Software Developers sit at a $139,027 median across 73,058 certified cases. Meat, Poultry, and Fish Cutters and Trimmers sit at $26,000 across 9,214. Those aren't edge cases. They're the first and the third busiest occupations in the file.
Filtering it down to your own job
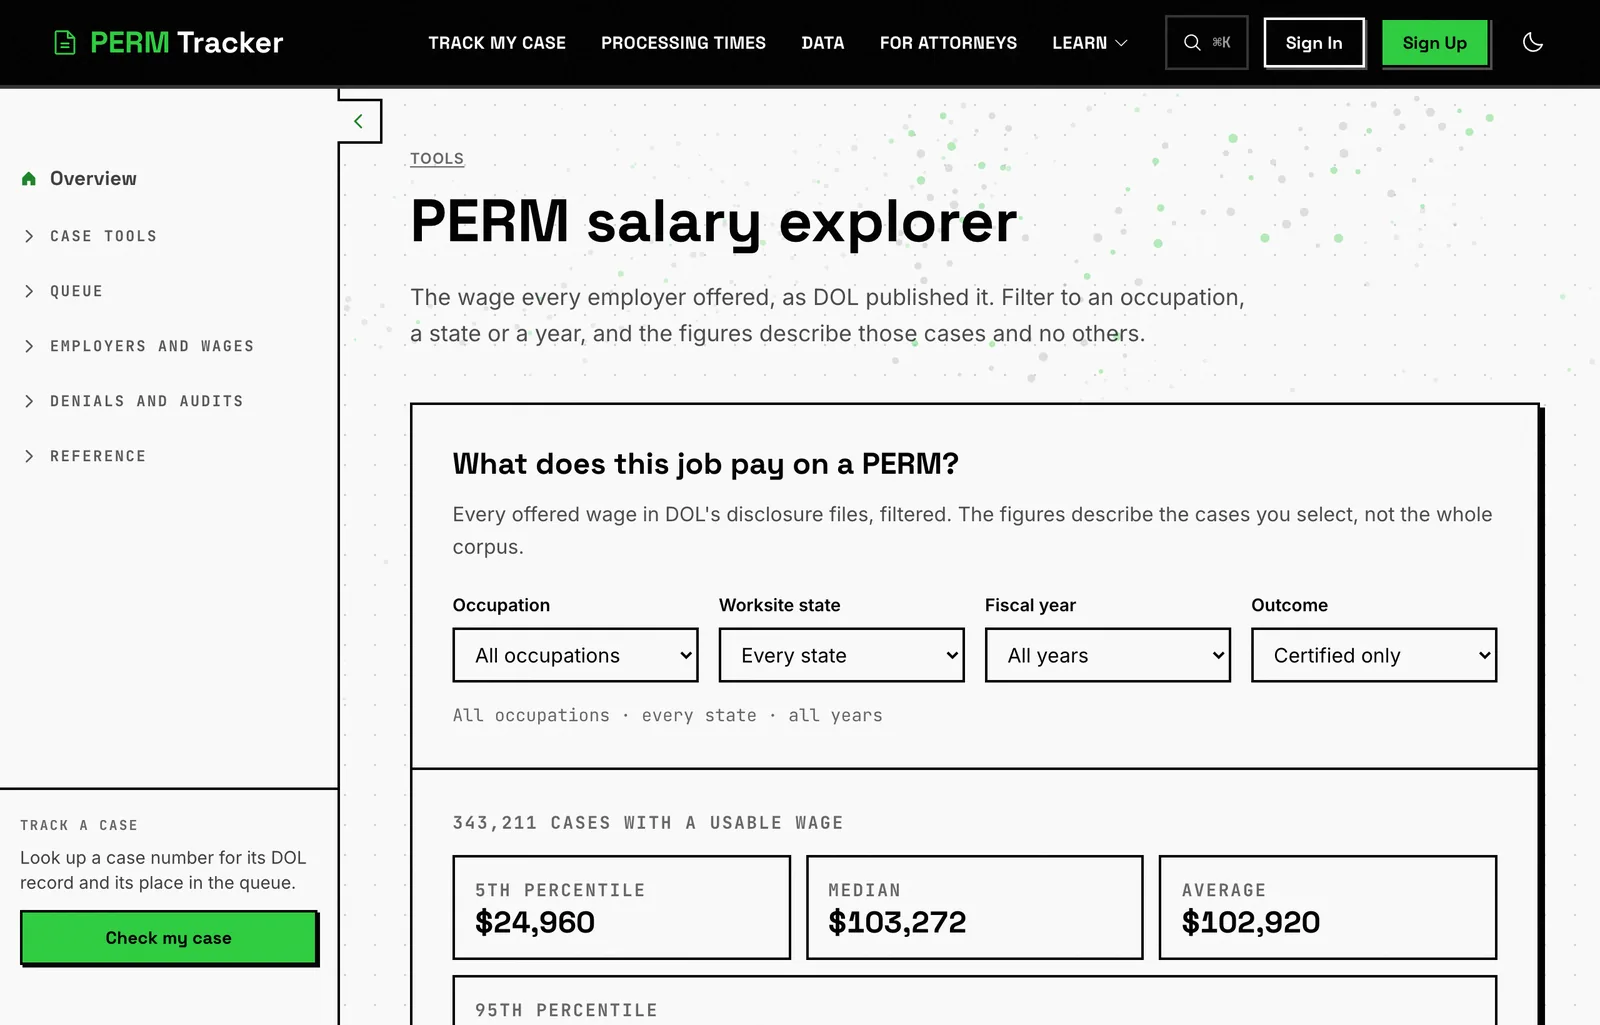
The salary explorer takes four filters: occupation, state, fiscal year and outcome. Certified only is the default, because a denied case's offered wage was never agreed to by anyone. Every other outcome is one control away.
Two rules are worth knowing before you read a filtered figure.
🚨 Thin selections report nothing rather than something
Below 30 matching cases no figure is shown at all, because a median that size moves by thousands when a single case lands. Between 30 and 100 you get the middle and the 5th and 95th are withheld, since each tail would be resting on fewer than five filings.
The explorer also stacks every state on one axis, which is a different question from the one the filters answer. The filters show one selection at a time. The axis shows all of them against each other.
Reading a state
The state page maps every certified, denied and withdrawn case to its worksite state. You can colour the map by filings, approval rate, denial rate, median days or median wage, and set a minimum case floor so a state with 40 filings isn't shaded with the same confidence as one with 67,000.

The table underneath sorts on every column, filters by region, and downloads as a CSV. It carries filings, certified, denied, withdrawn, decided, approval rate, median days and median wage for all 55 states and territories.
Why one number is the wrong thing to take away
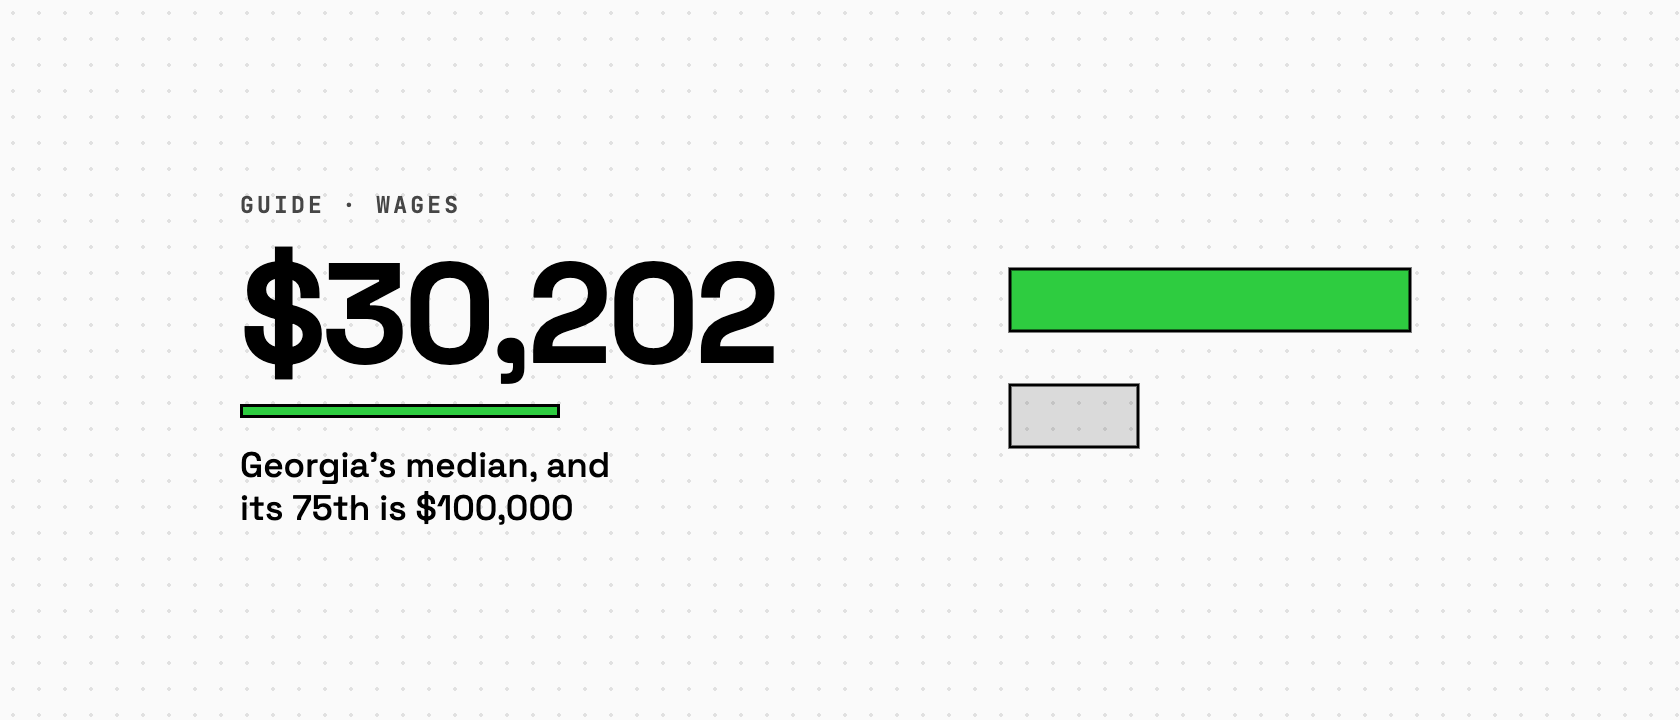
Georgia is the clearest case in the data. Its median offered wage is $30,202. Its 75th percentile is $100,000.
| Georgia, certified cases | Offered wage |
|---|---|
| 25th percentile | $24,360 |
| Median | $30,202 |
| 75th percentile | $100,000 |
| 90th percentile | $137,000 |
Nobody in Georgia is being offered "about $30,000". Two separate populations file there, a large low-wage one and a smaller high-wage one, and the median lands in the trough between them. Quote that median as the state's PERM salary and you'd be wrong about both groups at once.
The same trap sits under every filter. A median is only a useful summary when the thing it summarises has one hump. Check the range before you quote the middle, and if a percentile spread looks like a canyon rather than a curve, narrow to an occupation before drawing anything from it.
What this can't tell you
- What the job pays. This is the offered wage on a federal form. It's a floor the employer committed to, and it excludes bonuses, equity and overtime. It is not a market survey.
- What you'll be offered. These are other people's filings at other employers. The distribution describes them and no one else.
- Why a wage came out where it did. DOL doesn't publish its reasoning, and neither do employers.
- Where anyone lives. The state is the worksite on the filing.
- A single risk number from the wage. Denial rates by wage band are published, and they broadly fall as the wage rises, but the pattern is bumpy and wage, occupation and employer are entangled. Nothing here separates them, so no cause is offered and none of it is blended into one score.
- What's happening right now. These figures come from DOL's quarterly disclosure files, so they cover decided cases. For a live status, look up the case number instead, which asks DOL directly and is refreshed daily.
Related
- Wage requests by employer, for the determination behind a specific filing
- How DOL sets a prevailing wage
- Denial and audit rates, measured and left unblended